Shoreline and Datadog Empower Cross-functional On-call Teams with Visibility and Remediation Tools
For the first time, users can see issues and act in real-time, directly from the DataDog User Interface
Datadog provides unprecedented visibility into your infrastructure, apps and logs. Now you can act on this data with Shoreline. After a Datadog monitor fires, Shoreline provides debugging and remediation features. For your most common issues, Shoreline makes it easy to automate remediation. And you can do all of this without ever leaving the Datadog user interface.
Watch a Demo of Datadog and Shoreline Together
Go deep with Shoreline debugging
Streamline remediation with pre-built actions
Automate away common, low value incidents
Turn On Shoreline In Datadog
Getting started with Shoreline is easy. We will have you up and running in 30 minutes and even help you build your first automation.
Empower Everyone On-call To Be As Good as Your Best SRE
Create a library of best practice debugging tools and pre-built remediation actions so that everyone on-call is fixing incidents correctly and safely.


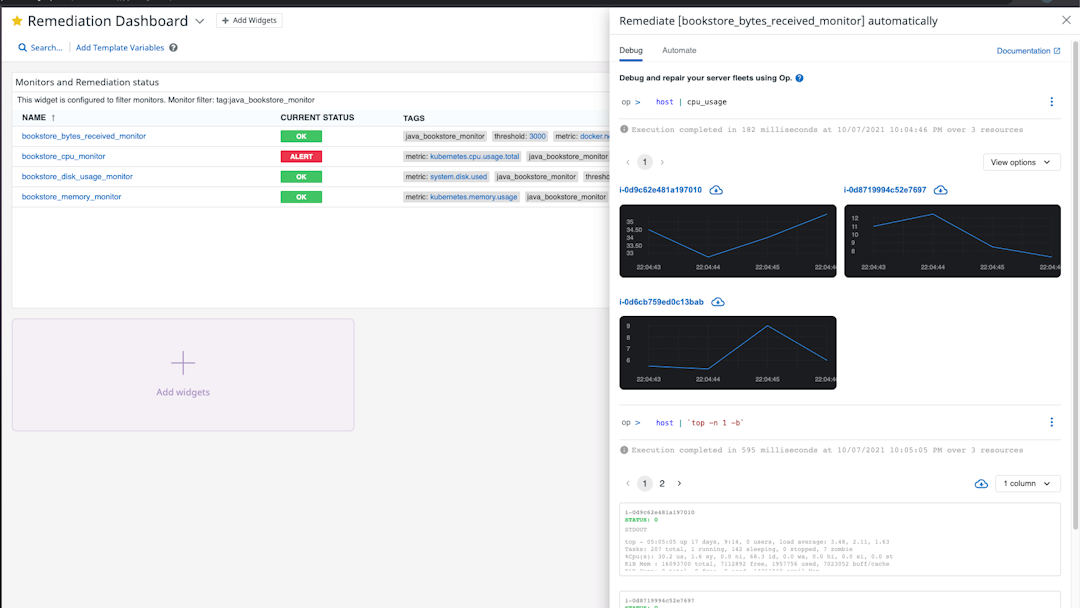
Debug with Shoreline’s CLI inside Datadog
No more switching back and forth between windows and no more SSH-ing into box after box. When a Datadog monitor fires, you can start debugging on the same screen. With Shoreline, you can run Linux commands in parallel on every affected node, collect summary data, and find needle-in-the-haystack anomalies in seconds.
Remediate with Approved, Pre-built Actions
Instead of documenting playbooks in wikis, create live, best-practice remediations with role-based access controls. Give your on-call team the flexibility to apply these remediations to one or many hosts at the same time. Built-in blast controls and circuit breakers safeguard against mistakes.

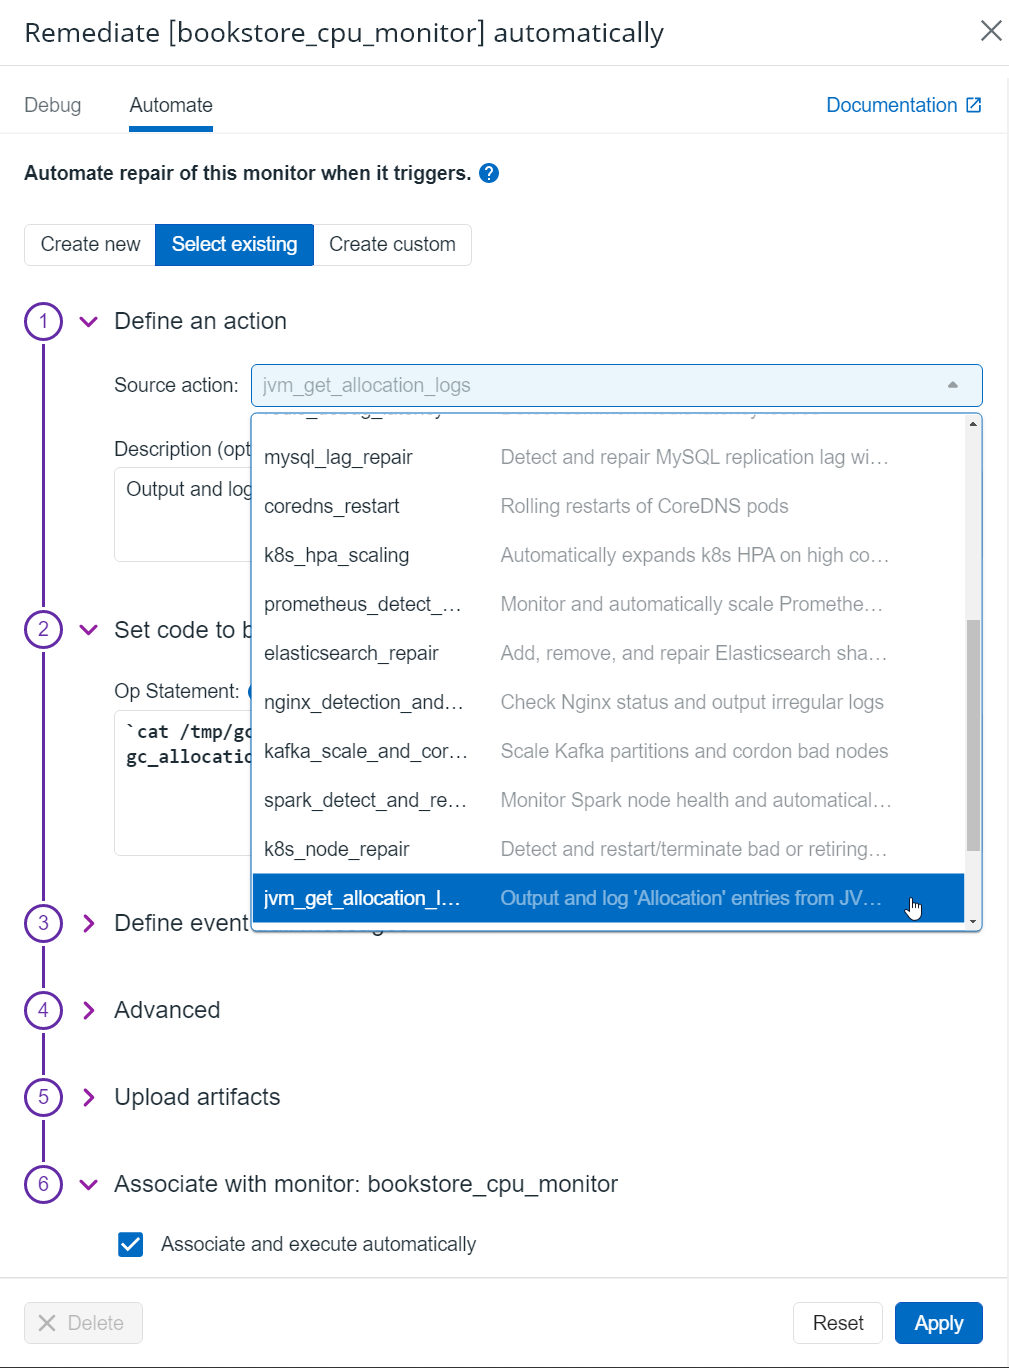
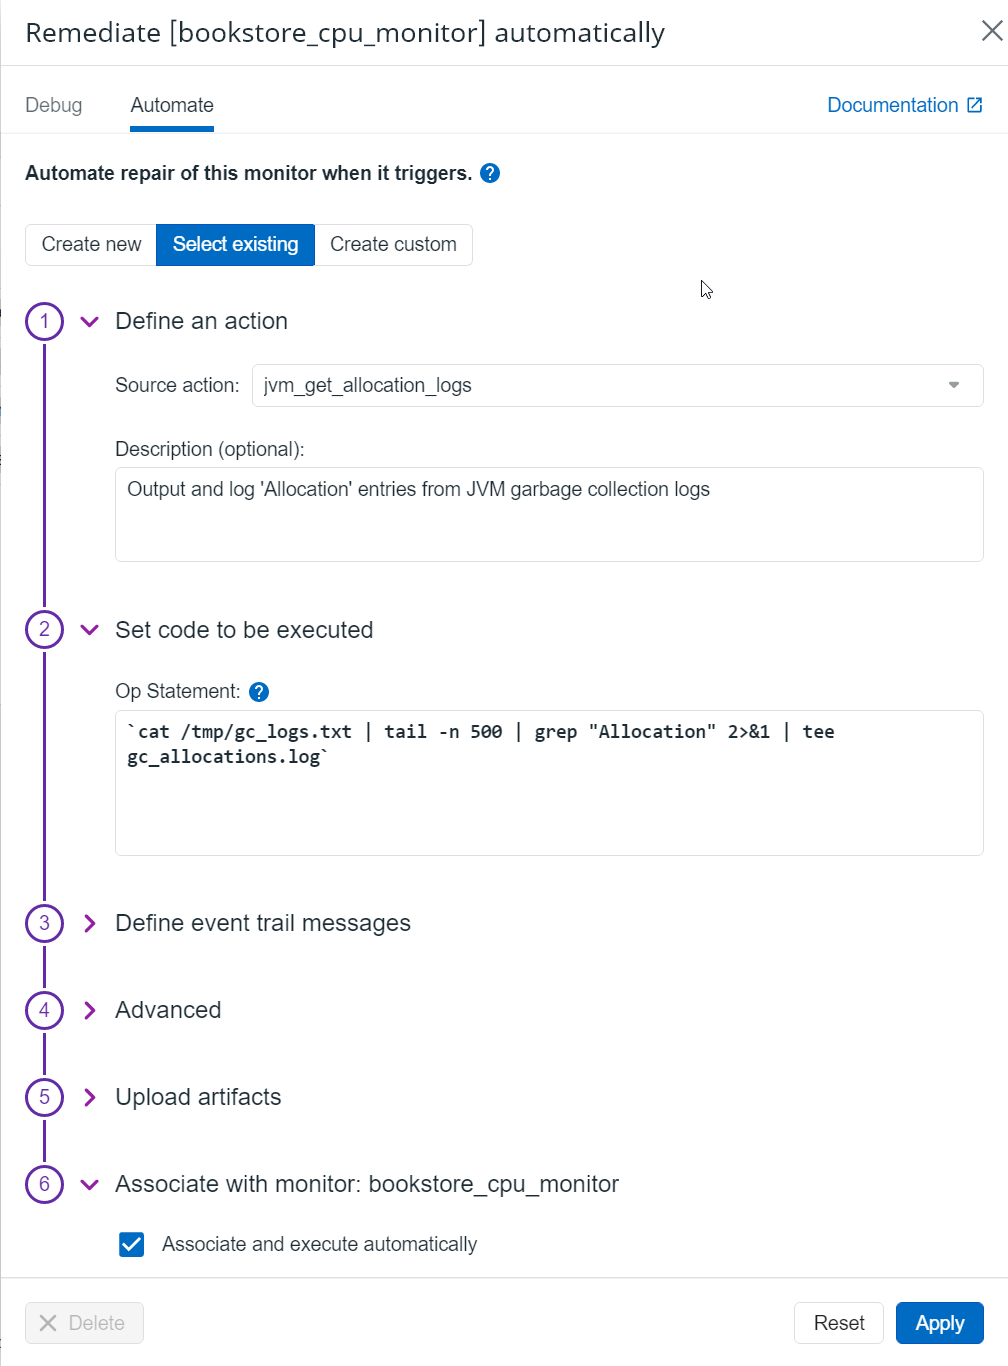
Create Automated Remediations Tied to Datadog Monitors
For your most common incidents, create automated remediations and eliminate interruptions and 2am wake up calls. Create fine grained monitors that determine the root cause with confidence. Tie a Shoreline automation to a Datadog monitor in just a few clicks.
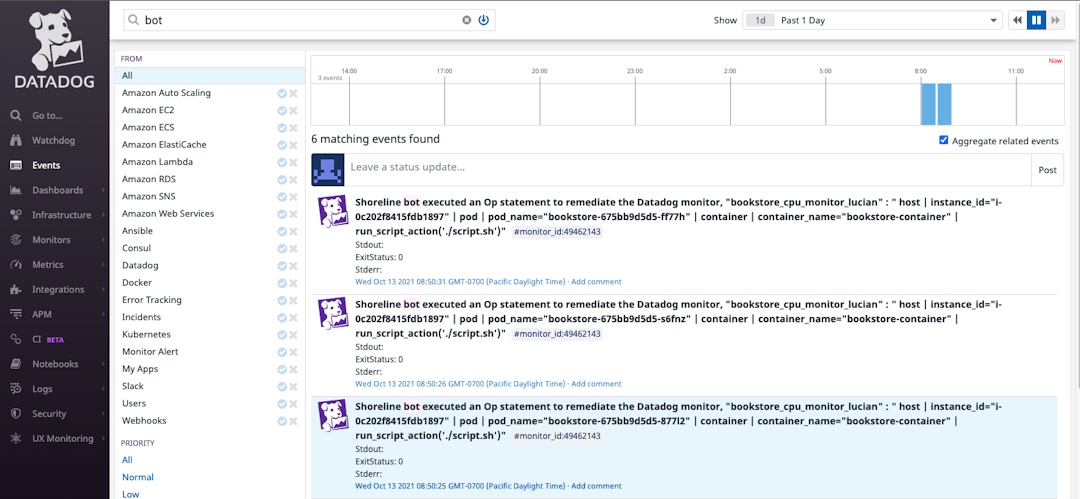
View Audit Logs In The Datadog Event Stream
Track both manual and automated remediation activities. Provide reports to engineering on the most common incidents to help them improve reliability. Publish data to your security and compliance systems so that you can document every action that occurred in your production system.